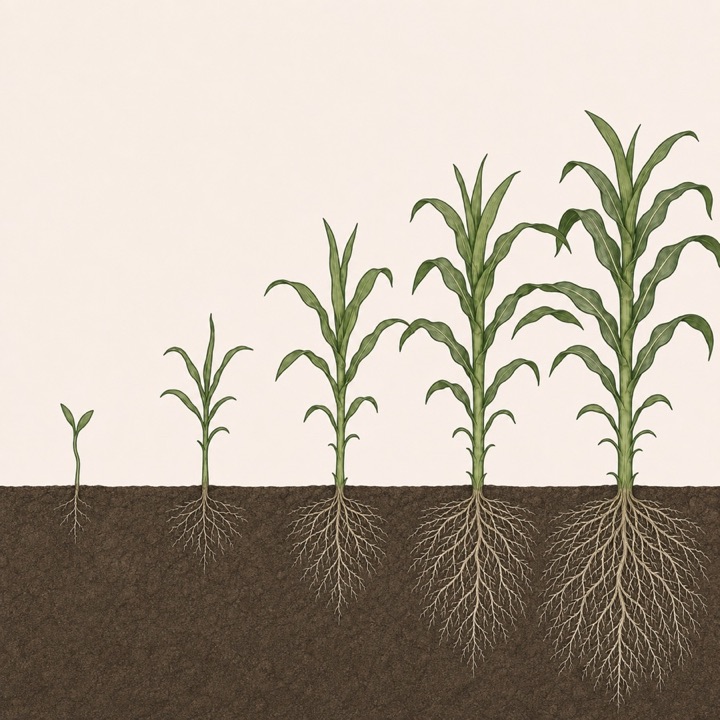
Canopy cover
Tracks canopy development from emergence through senescence, including how temperature, weather stresses, and soil-water availability accelerate or constrain green canopy expansion.
 AquaCropUC Davis Global Environmental Change LabView code
Crop–water science, scaled
A flexible, open Python implementation of FAO AquaCrop, developed and maintained by the UC Davis Global Environmental Change Lab to connect process-based crop science with field observations, remote sensing, and subnational yield data.
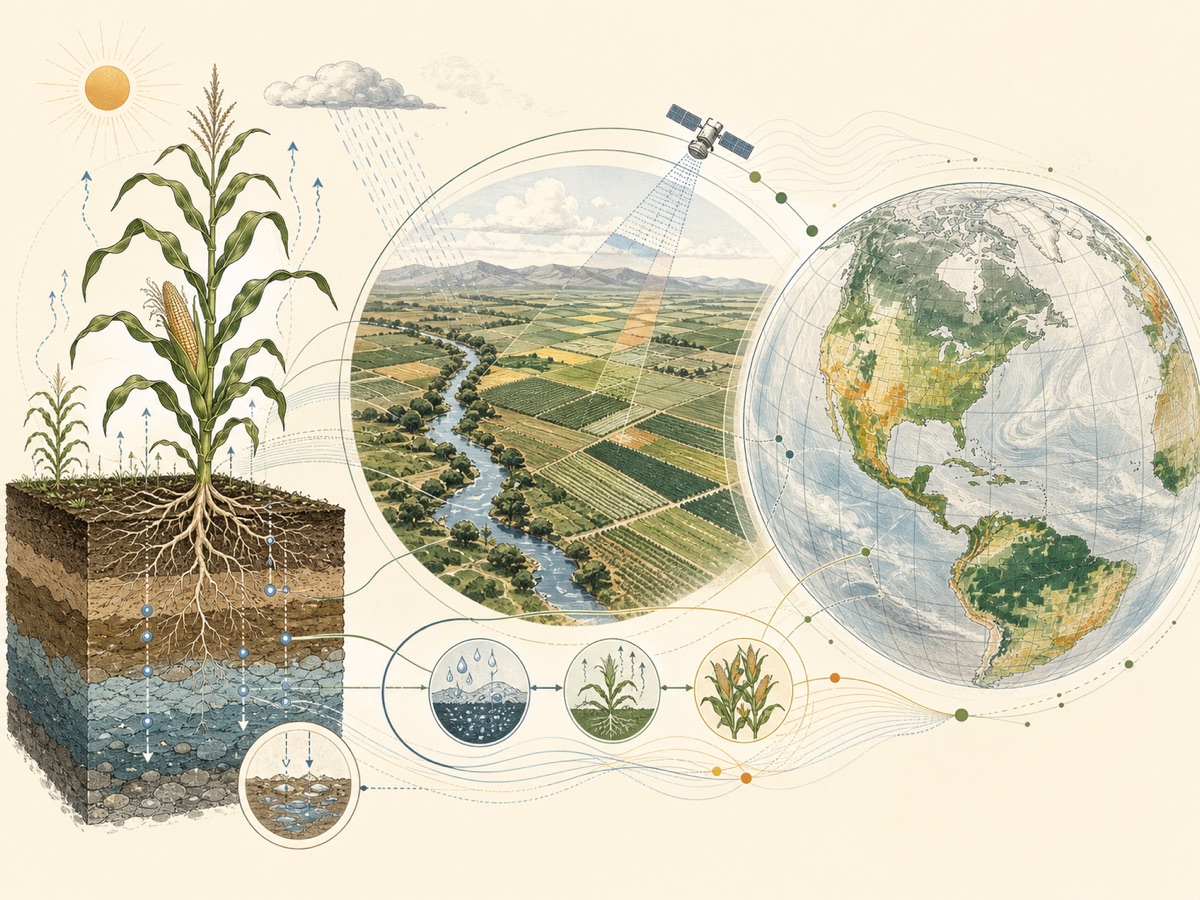 Process-based modeling across scales
The model
AquaCrop is FAO's process-based crop model for simulating crop growth and yield response to water. It balances biological realism with a relatively small set of parameters—making rigorous analysis accessible where data are limited.
Visit FAO AquaCrop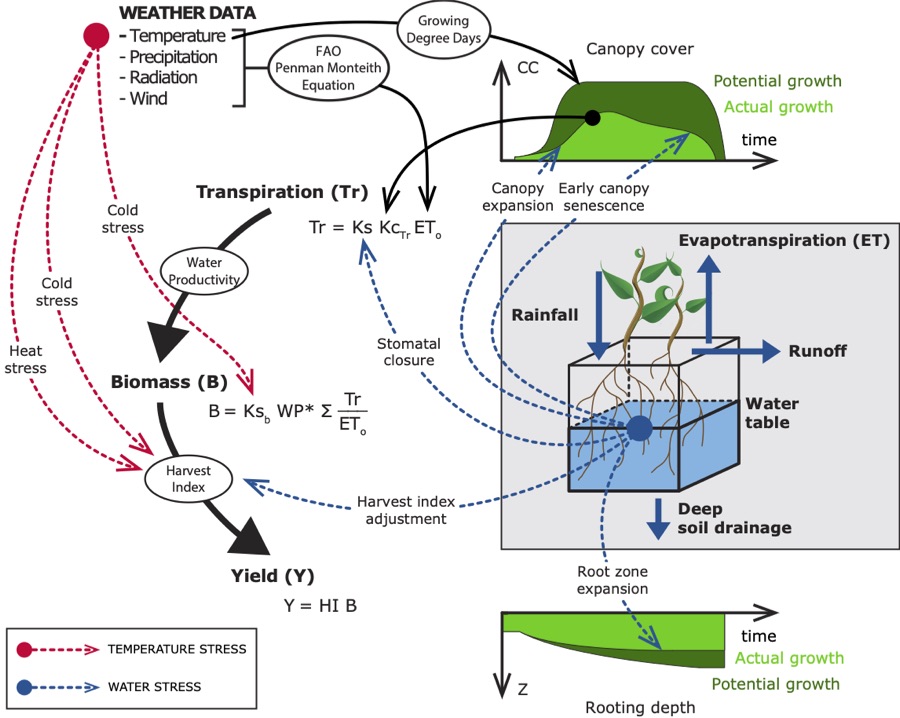 AquaCrop process schematic
Tracks canopy development from emergence through senescence, including how temperature, weather stresses, and soil-water availability accelerate or constrain green canopy expansion.
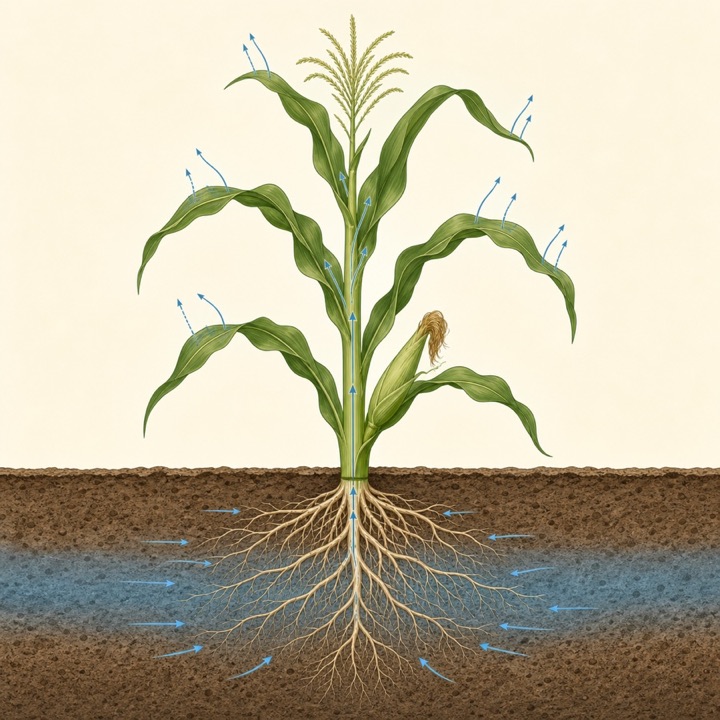
Calculates crop water use from reference evapotranspiration and canopy cover, while adjusting root uptake and stomatal response as soil water becomes limiting.
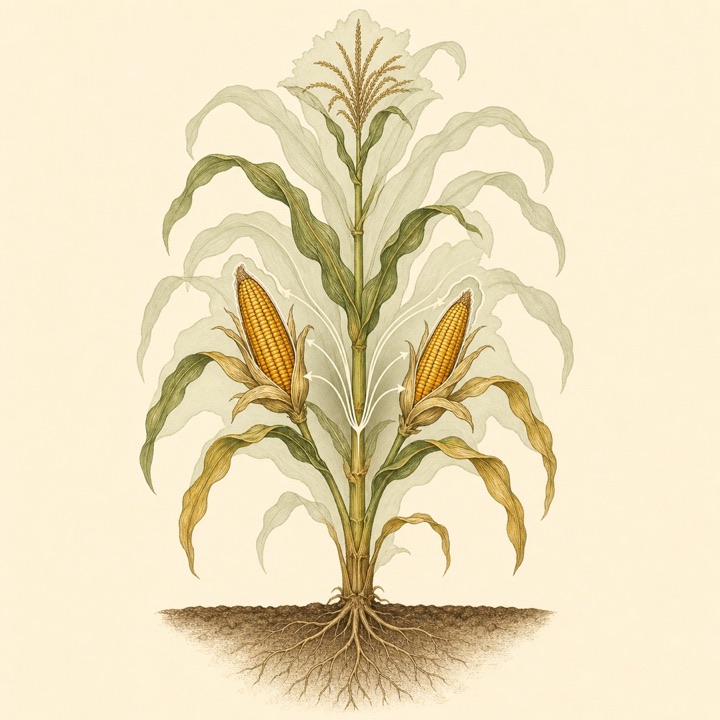
Converts transpiration into aboveground biomass through normalized water productivity and applies the dynamic harvest index to translate biomass into crop yield.
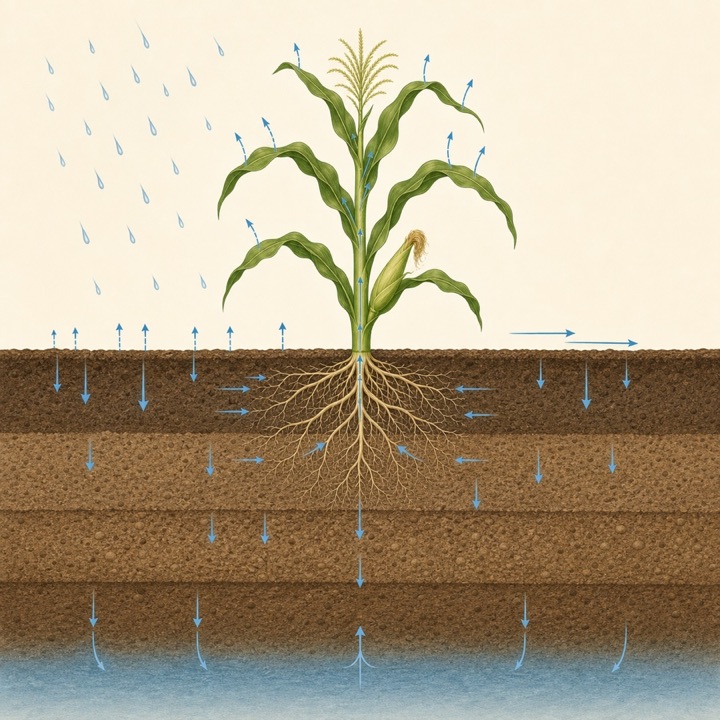
Represents the full hydrological cycle across multiple soil layers, including rainfall, runoff, infiltration, evaporation, root uptake, redistribution, deep drainage, and groundwater interactions.
From process to decisions
AquaCrop turns daily weather, soil, crop, and management data into water-balance and crop-growth information for planning across fields, regions, and climates.
Water resources
Estimate daily evapotranspiration, irrigation requirements, soil-water depletion, and seasonal crop demand under changing weather.
Food production
Assess attainable and water-limited yield while tracing how transpiration becomes biomass and harvestable production.
Climate risk
Test crop response to heat, drought, rainfall variability, elevated CO₂, and future climate scenarios.
Management
Compare full, deficit, and supplemental irrigation schedules to balance yield outcomes with limited water supplies.
One flexible framework
Bring the best available observations into one transparent workflow—from detailed field experiments and farm records to remote-sensing products, regional statistics, and long subnational yield records. The framework calibrates AquaCrop at the spatial scale required by the research question while maintaining a consistent, reproducible treatment of parameters, observations, and uncertainty.
Local
Calibrate phenology, canopy, biomass, soil moisture, and yield against observations from trials and farms.
Regional
Merge satellite observations with county yield records to constrain crop dynamics across heterogeneous landscapes.
Continental to global
Use long yield records and representative locations to build robust crop parameterizations across climate zones.
Our framework
A transparent three-stage workflow selects climate-representative rainfed and irrigated locations, uses global sensitivity analysis to identify the most influential parameters, and applies Shuffled Complex Evolution to calibrate them efficiently. Evaluation beyond the calibration locations shows that this approach improves the model accuracy across climates and management systems.
Global sensitivity analysis
Sobol analysis screens the full model and retains parameters with meaningful total-order influence across climate, soils, and management.
Calibration engine
Shuffled Complex Evolution evolves candidate solutions in parallel and regularly shares information—combining broad exploration with focused refinement while resisting local optima.
U.S. maize evaluation
Twenty years of observations from nine rainfed and eight irrigated counties improved performance across U.S. maize-producing regions.
Wu et al. (2026), manuscript in preparation
Open science
The UC Davis implementation reproduces the official FAO model while opening the workflow to Python's data, visualization, calibration, and machine-learning ecosystem.
from aquacrop import AquaCropModel

model = AquaCropModel(
  weather=climate,
  soil=soil_profile,
  crop="Maize",
  management=scenario
)

results = model.run()The people behind the framework
The UC Davis Global Environmental Change Lab, led by Professor Erwan Monier, brings together model development, crop and climate science, calibration, remote sensing, and applications across scales.
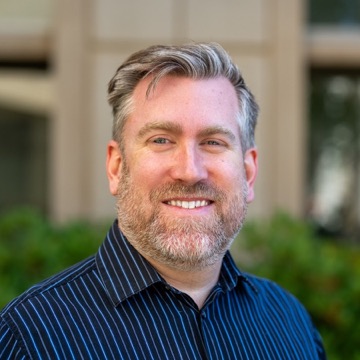 Principal investigator
Project leadership.
 Former Ph.D. researcher
Python implementation, sensitivity analysis, and continental calibration and evaluation for U.S. maize. Now a postdoctoral researcher at Emory University, calibrating AquaCrop for peanut and soybean in Georgia.
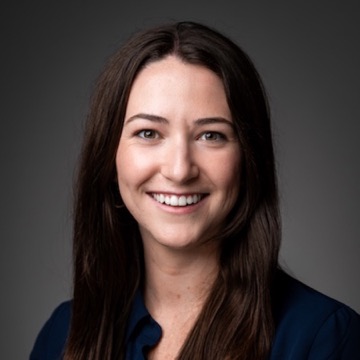 Graduate researcher
Multiscale calibration framework integrating field, remote-sensing, and subnational yield data.
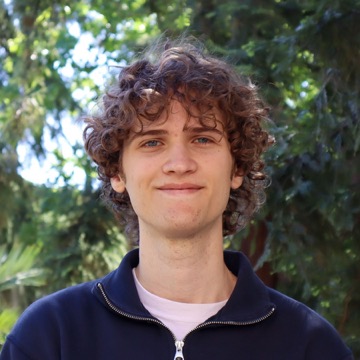 Former undergraduate intern
Investigated geoengineering impacts on crop yield using AquaCrop. Now a Ph.D. student at Boston University.
Knowledge base
UC Davis · View on eScholarship
Field observations, remote sensing, county records, and global subnational yield data. Led by Heather and the UC Davis Global Change team.
Steduto, Hsiao, Raes & Fereres
Raes, Steduto, Hsiao & Fereres
Steduto, Hsiao, Fereres & Raes
Salman, Garcia-Vila, Fereres, Raes & Steduto